Kubernetes Cost Optimization Tools in 2026: Which One Actually Reduces Your Bill?

Debo Ray
Co-Founder, CEO

Kubernetes cost optimization has a measurement problem: almost every published waste statistic is an estimate. So we measured real ones instead.
When a customer connects a cluster to DevZero, the first thing that happens is nothing — the agent installs read-only and simply watches. That gives us an unusually clean picture of what a production Kubernetes cluster looks like before anyone has optimized it. Across a representative sample of 115 customer production clusters running roughly 328,000 nodes, all measured in that pre-optimization state, the median cluster uses 19.6% of the CPU it reserves. Across the sample, 70.8% of all requested CPU is never used at all.
This is the starting line, not the finish line. Every number in this article describes the problem as it arrives, before a single request has been rightsized.
You pay for the reservation, not the usage. The invoice arrives every month, the capacity sits there, and your applications never touch it.
This happens because there are two distinct categories of Kubernetes cost tools. The first category includes visibility tools. They tell you exactly where your money goes. The second category includes optimization tools. They actively stop the financial bleeding.
Most buyers confuse the two. They purchase a visibility tool, install it, check the dashboard, and wonder why their Amazon Web Services (AWS) or Google Cloud bill stays the same. By the end of this blog, you'll understand exactly which tool to choose based on your team size, your cloud setup, and your goals.
Key Takeaways#
- Kubernetes cost optimization starts with understanding why clusters waste resources — overprovisioning, poor bin packing, and oversized non-production environments are the biggest contributors to cloud spend.
- Not all cost tools solve the same problem. Visibility platforms help you understand where money is going, while optimization platforms automatically reduce infrastructure costs by rightsizing workloads.
- When comparing Kubernetes cost optimization tools, evaluate automation, production safety, GPU support, rightsizing capabilities, pricing model, and cloud compatibility — not just reporting features.
- The best solution depends on your infrastructure and goals. Small teams may only need visibility, while enterprises with larger cloud bills benefit most from automated optimization combined with FinOps reporting.
- Modern Kubernetes cost management goes beyond CPU optimization. GPU utilization, AI inference costs, staging environments, and workload attribution now play a major role in controlling cloud spend.
- Sustainable cost savings come from continuous, autonomous optimization rather than one-time recommendations, helping engineering teams reduce cloud costs without sacrificing application performance or reliability.
Why Is Kubernetes So Expensive in the First Place?#
You need to understand the root cause of the waste before you can select a tool to fix it.
Kubernetes was designed to keep applications running. It was not designed to save you money. When Google originally built the internal system that inspired Kubernetes (called Borg), they included strict resource controls. When Kubernetes became an open-source project, many of those strict cost-control measures were left behind. The platform prioritizes uptime above all else.
This creates a massive financial gap for CXOs. Here is where the money actually goes.
Engineers overprovision by default: When developers deploy an application, they must tell Kubernetes how much computing power it needs. These are called "resource requests." Because engineers fear application crashes, they err on the high side.
They might reserve two full processors for an application that only needs a fraction of one processor. You pay for the reservation, regardless of actual usage.
The bin packing problem: Kubernetes acts like a warehouse manager loading boxes (applications) onto delivery trucks (servers). The default scheduler spreads pods across nodes for availability rather than packing them tightly for cost. You end up renting servers that are only partly full — in the sample the median cluster has just 42.3% of its CPU capacity even requested, before you account for the fact that only a fraction of those requests are used.
Copy-paste environments: Your team likely runs multiple versions of your software. You have the live production version, a staging version for testing, and maybe a development version. Engineers frequently copy the exact same massive server requirements from the production environment into the testing environments.
Here is what that actually looks like when you measure it. The table below is the share of requested CPU that is never used, broken out by workload type, across the 115-cluster sample over a trailing 7-day window:
| Workload type | Clusters measured | Requested CPU never used |
|---|---|---|
| DaemonSet | 115 | 86.4% |
| Bare Pod | 46 | 79.0% |
| Deployment | 115 | 71.8% |
| Job | 29 | 70.4% |
| StatefulSet | 81 | 70.3% |
| CronJob | 83 | 58.1% |
Two things here contradict the conventional wisdom. First, the received advice is that batch work is the worst offender — in this sample, CronJobs are the least wasteful workload type, because they are sized for a job that actually runs and then exit. Second, DaemonSets are the worst, at 86.4%. Nobody rightsizes DaemonSets. They are usually installed once from a vendor's default manifest, they run a copy on every node in the cluster, and that default is sized for the largest node anyone imagined. Every node you add multiplies the mistake.
The practical read: there is no low-waste corner of a Kubernetes cluster to retreat to. Every workload type in the sample wastes more than half of what it reserves.
What Actually Drives Kubernetes Cost#
When teams set out to cut a Kubernetes bill, they tend to start wherever the most recent conference talk pointed them — usually GPUs, sometimes storage. Our telemetry says the money is somewhere much more boring.
Here is how spend actually splits across the sample, measured over the same 7-day window:
| Cost driver | Share of total cluster cost |
|---|---|
| CPU | 66.6% |
| Memory | 30.1% |
| GPU | 3.3% |
Two-thirds of the bill is CPU. That matters because CPU is also the resource teams over-request most severely — the median cluster uses 19.6% of what it asks for, while memory runs at a comparatively disciplined 57.6%. The waste and the money are concentrated in the same place.
This does not mean GPU optimization is unimportant; for the subset of teams running AI workloads it is often the single largest line item, and it is why we build for it. But across a broad fleet, a team that spends its first optimization quarter on GPUs is fine-tuning 3.3% of the bill while two-thirds of it sits untouched.
Where Waste Concentrates: The Real Distribution#
Averages hide the shape of this problem, and the shape is the actionable part. Here is the per-cluster distribution of CPU actually used versus CPU requested:
| Percentile | CPU used of CPU requested |
|---|---|
| p10 (worst clusters) | 4.9% |
| p50 (median) | 19.6% |
| p90 (best clusters) | 43.8% |
Read the top row carefully. A tenth of the clusters sampled use under 5% of the CPU they reserve — they are paying for twenty times the compute they consume. Even the best-run decile, at p90, leaves more than half of its requested CPU on the floor.
Waste is also not spread evenly, which is the single most useful fact for prioritizing the work:
30 of the 115 clusters (26.1%) run below 12% CPU-used-of-requested. Those clusters carry 29.6% of the sample's total cost.
A quarter of clusters hold nearly a third of the spend, and they are the ones with the least defensible utilization. If you are deciding where to point a rightsizing effort first, you do not need a fleet-wide program — you need to find your worst-utilized quarter. That is where the recoverable money is.
Three notes on how to read all of this. The sample is 115 customer production clusters that were actively reporting telemetry to DevZero across the trailing 7-day window — a cross-section of the clusters we monitor, not a count of them. All of them were in read-only assessment at the time of measurement, with automated optimization not yet applied, which is precisely why these figures describe the baseline rather than the outcome. These are other people's real production environments, not our own infrastructure or a benchmark rig, which is what makes the numbers worth reading; everything here is reported strictly in aggregate, with no cohort under 25 clusters and nothing traceable to an individual customer. Because these are clusters that chose to run the DevZero agent, the sample skews toward teams who already suspect they have a cost problem; that is a real selection effect and we would rather name it than bury it. Every figure is measured from node-level telemetry, deduplicated per (cluster, timestamp, node), with any cohort under 25 clusters excluded as too thin to publish. And we re-derived the headline ratio independently from container-level telemetry as a check: that path puts the median at 15.4% rather than 19.6%, because node-level requests include DaemonSet and system overhead. Both paths tell the same story; we publish the higher, more conservative-for-us number.
Visibility Tools vs. Optimization Tools: Why This Distinction Matters#
The market separates into two clear paths. You must decide whether you need to know about the waste or stop it.
Visibility Tools: Tools like Kubecost, OpenCost, CloudZero, and Finout fall into this category. They connect to your cloud provider billing and map those costs to your specific engineering teams. They generate excellent reports. They send alerts when spending spikes. They do not change your server allocations. A human engineer must read the report, log into the system, and manually reduce the server sizes.
Optimization Tools: Tools like DevZero, Cast AI, and ScaleOps actively change your resource allocations. They monitor the actual usage of your applications. When they see an application using less memory than it has reserved, the tool shrinks the reservation. This allows you to turn off rented servers and lower your monthly bill. These tools carry more responsibility because they touch live infrastructure.
The gap between seeing the waste and taking action is where savings die, and it is a problem of scale rather than willingness. In the sample the median cluster runs 94 distinct workloads, but the 90th-percentile cluster runs 2,378 — and the largest runs over 19,000. No engineer is hand-auditing two thousand workloads a week, every week, forever. That is the entire reason recommendations pile up unactioned.
Your evaluation question is simple: Do you need a reporting dashboard or an automated engine to fix the problem?
Evaluation Criteria: How to Compare Kubernetes Cost Tools#
Don't evaluate these tools based on their marketing pages. Evaluate them based on how they handle live infrastructure. Use this framework to compare your options.
- Automation depth: Does the tool only provide recommendations, does it require a human to click a button, or does it run entirely on its own?
- Production risk (Pod restarts): When the tool resizes an application, does it need to restart it to apply the change? Restarting causes downtime.
- Hardware support: Does the tool optimize standard processors (CPUs), or can it also manage expensive AI hardware (GPUs)?
- Rightsizing method: Does the tool use standard open-source logic, or does it use machine learning to predict traffic spikes in advance?
- Cost visibility: Can the tool tell you exactly how much a specific software feature costs to run?
- Pricing model: Does the vendor charge a flat fee, a percentage of your savings, or a per-processor rate?
The 7 Best Kubernetes Cost Optimization Tools in 2026#
These platforms consistently appear across independent benchmarks, community forums, and implementation guides. Here is what each system actually does.
1. DevZero: Autonomous Optimization with Zero Restarts#
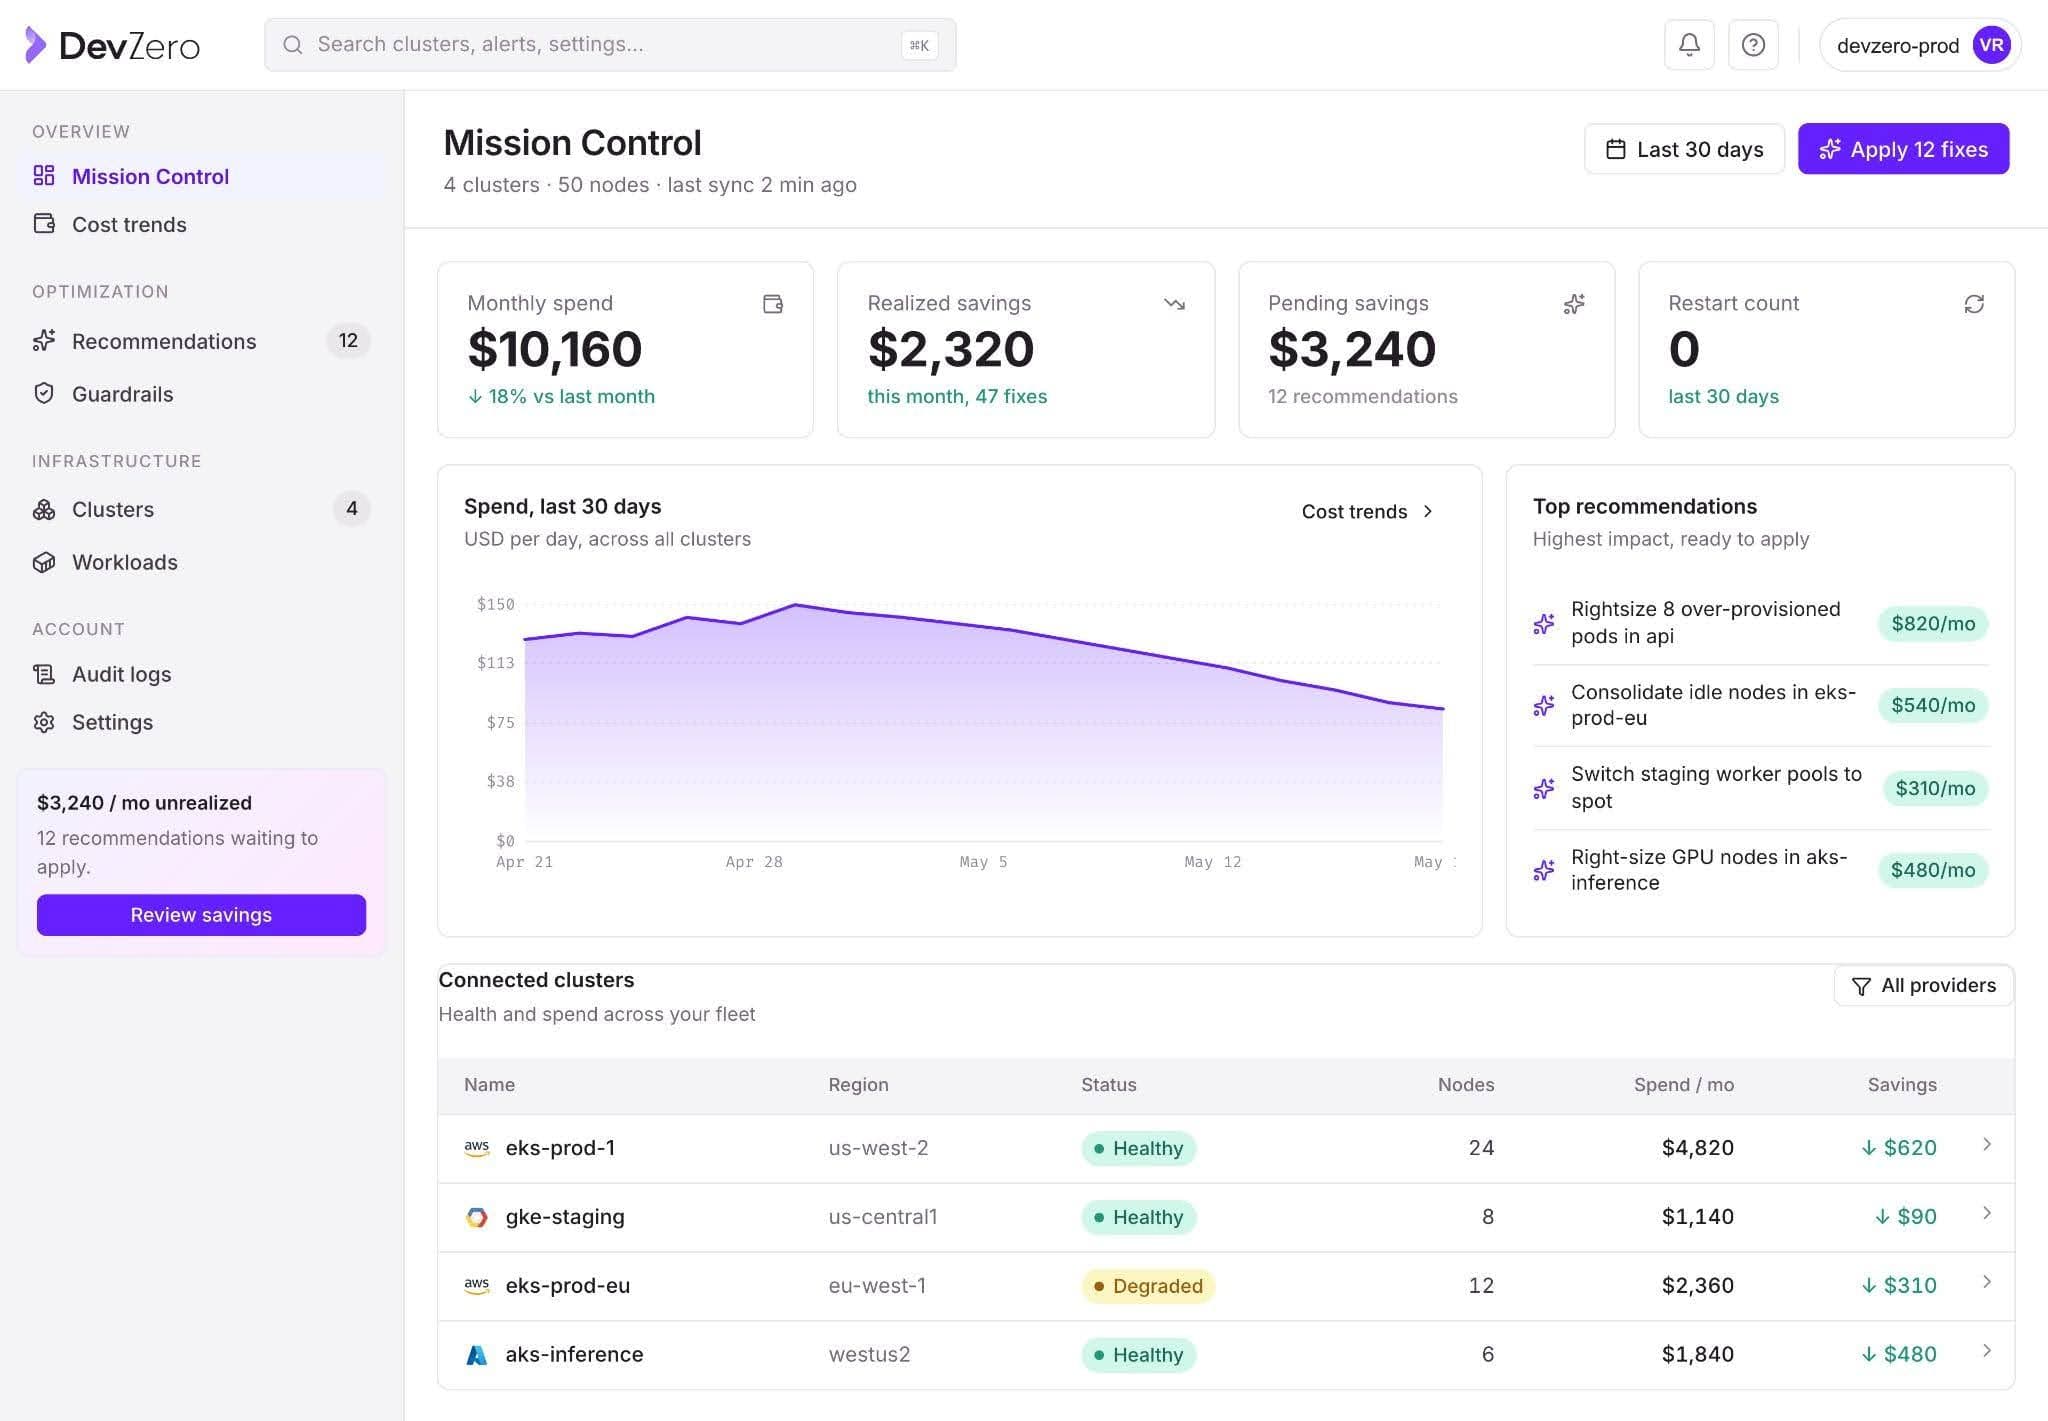
DevZero is an autonomous Kubernetes cost optimization platform. It profiles, schedules, and rightsizes workloads automatically. It also handles GPU optimization and routing for Large Language Model (LLM) inference.
The real business problem: You want to cut cloud costs, but your engineering team refuses to let an automated tool touch live production servers because they fear it will cause crashes and downtime.
The DevZero benefit: DevZero uses specialized technology (CRIU) to resize your applications while they are running. It does not restart your applications. Your users experience zero downtime, and your engineers get their time back. You get the cost savings without the operational risk.
Key capabilities:
- Zero pod restarts: DevZero uses Checkpoint/Restore in Userspace (CRIU) to pause an application, resize it, and resume it instantly. No other platform offers this live migration.
- Predictive scaling: It uses XGBoost machine learning to forecast traffic. It scales your servers up before a traffic spike hits, rather than waiting for the spike to overwhelm the system.
- GPU management: It partitions expensive NVIDIA hardware, allowing multiple teams to securely share a single chip.
- LLM inference: It routes AI requests efficiently to prevent massive bills from AI providers like OpenAI or Anthropic.
Implementation and results: You can install the read-only monitoring agent in under 45 seconds. It requires zero write access to your system. Within 24 hours, you receive a complete savings analysis. Reductions vary by how overprovisioned you start; the published case studies below are the documented range rather than an average we can generalize.
- DataBahn: Cut AWS costs by 75% in 10 hours.
- Fi Money: Reduced Kubernetes costs by 67% and eliminated 89% of overprovisioning.
- Personality Pool: Dropped daily spend by 30% on the very first day.
Limitations: DevZero does not offer a massive financial dashboard for complex corporate accounting showback out of the box (though the Enterprise plan allows data exports).
Best for: Companies with $50,000+ monthly cloud bills who want immediate savings without risking application downtime. It is the only choice if you run AI or GPU workloads.
See your savings estimate | Try free
If you're specifically replacing Kubernetes' native Vertical Pod Autoscaler rather than comparing full platforms, see our dedicated breakdown of Kubernetes VPA alternatives.
2. Kubecost (IBM Apptio): The FinOps Standard for Kubernetes Allocation#
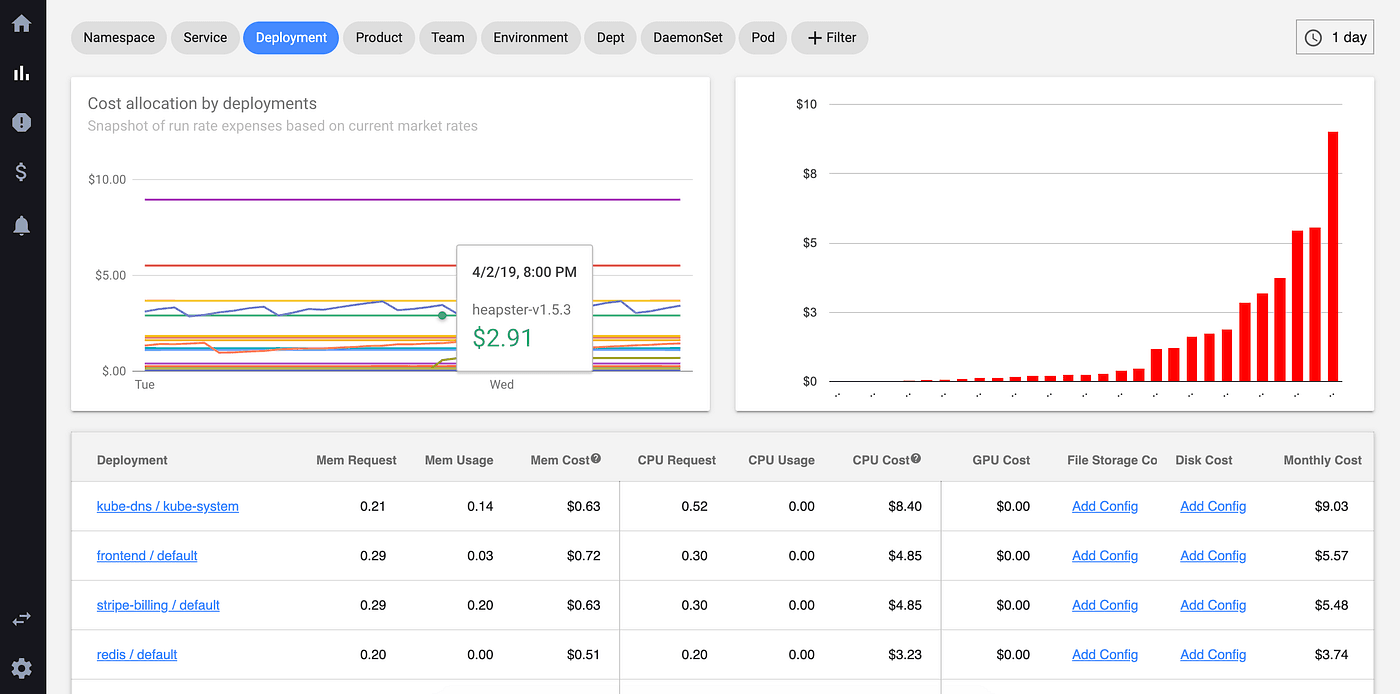
Kubecost is a reporting and allocation platform. IBM Apptio acquired the company.
The real business problem: Your finance team gets a $100,000 bill from AWS. They have no idea if the marketing team, the sales team, or the data team spent the money.
The Kubecost benefit: Kubecost acts like an itemized receipt for your cloud infrastructure. It breaks down exactly which department, team, or specific software feature generated the cost.
Key capabilities:
- Granular cost allocation down to the specific software label.
- Billing reconciliation against your actual AWS, Google Cloud, or Azure invoice.
- Free Foundations tier for up to 250 cores.
Limitations: Kubecost provides recommendations, but human engineers must log in and apply the changes. It does not actively reduce the bill on its own. Following the IBM acquisition, the product roadmap heavily favors financial reporting integrations rather than engineering automation.
Best for: Finance departments that need to charge cloud costs back to specific business units.
3. CAST AI: Node-Level Automation for EKS/GKE/AKS#
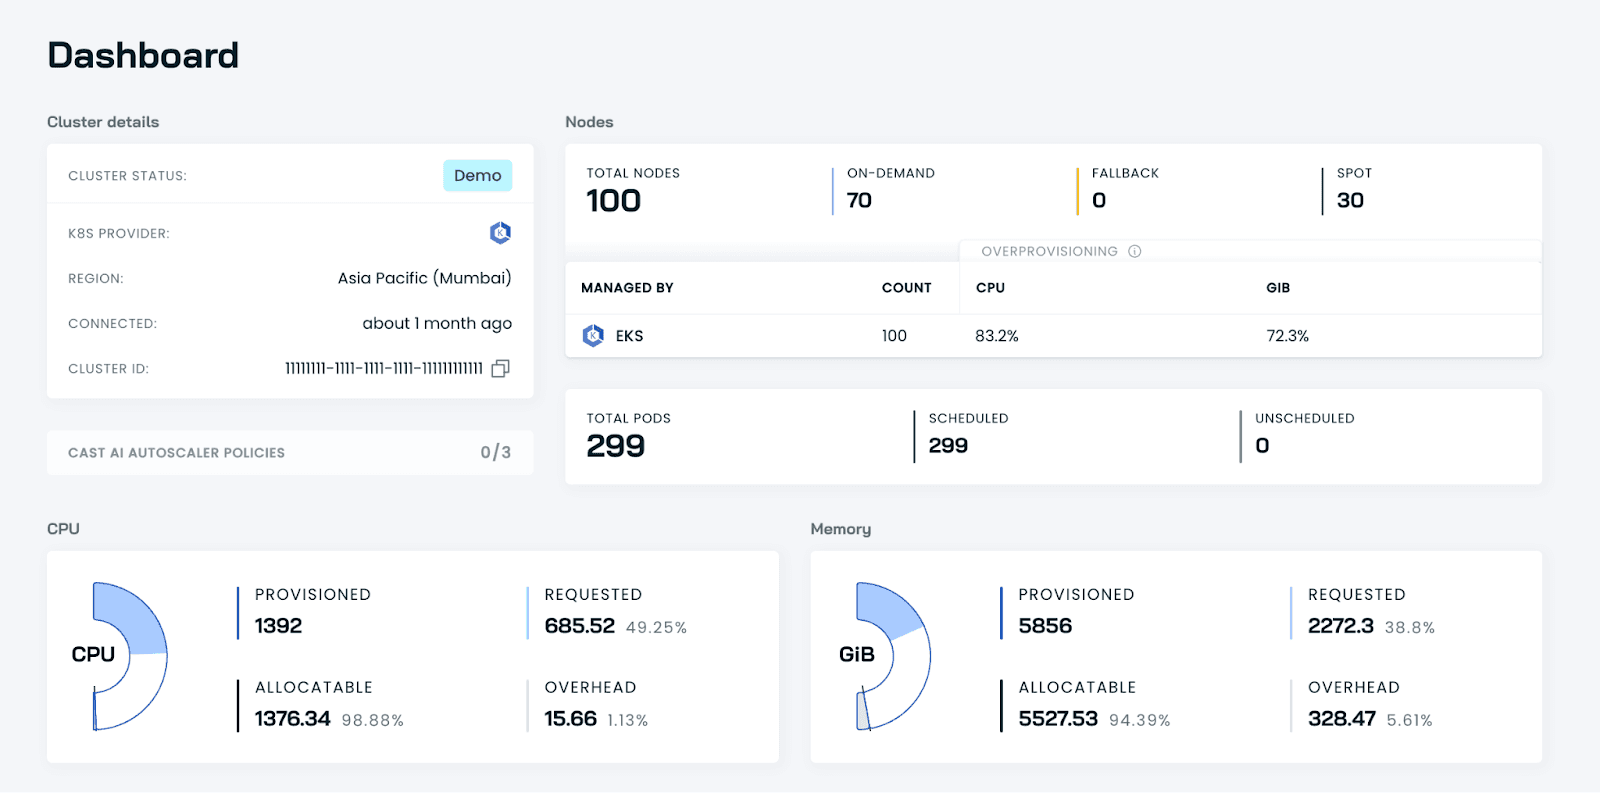
CAST AI replaces the standard Kubernetes server management tool with its own automated system.
The real business problem: Your engineers spend hours manually choosing which types of servers to rent from the cloud provider, trying to guess which size is the most cost-effective.
The CAST AI benefit: The platform constantly analyzes the cloud provider's pricing. It automatically buys and sells server capacity on your behalf to secure the lowest possible rate for your current traffic.
Key capabilities:
- Strong server-level (node) automation.
- Automated management of discounted "Spot" instances.
- Packs applications tightly onto servers to minimize the amount of rented hardware.
Limitations: To resize an application, CAST AI must restart it. This introduces a risk of downtime for sensitive workloads. It scales reactively, meaning a sudden traffic spike will hit your system before the platform provisions new servers. It offers limited support for GPU optimization.
Best for: Teams with heavy AWS workloads who are willing to give full control of their server provisioning to a third party.
4. OpenCost: The Free CNCF Baseline#
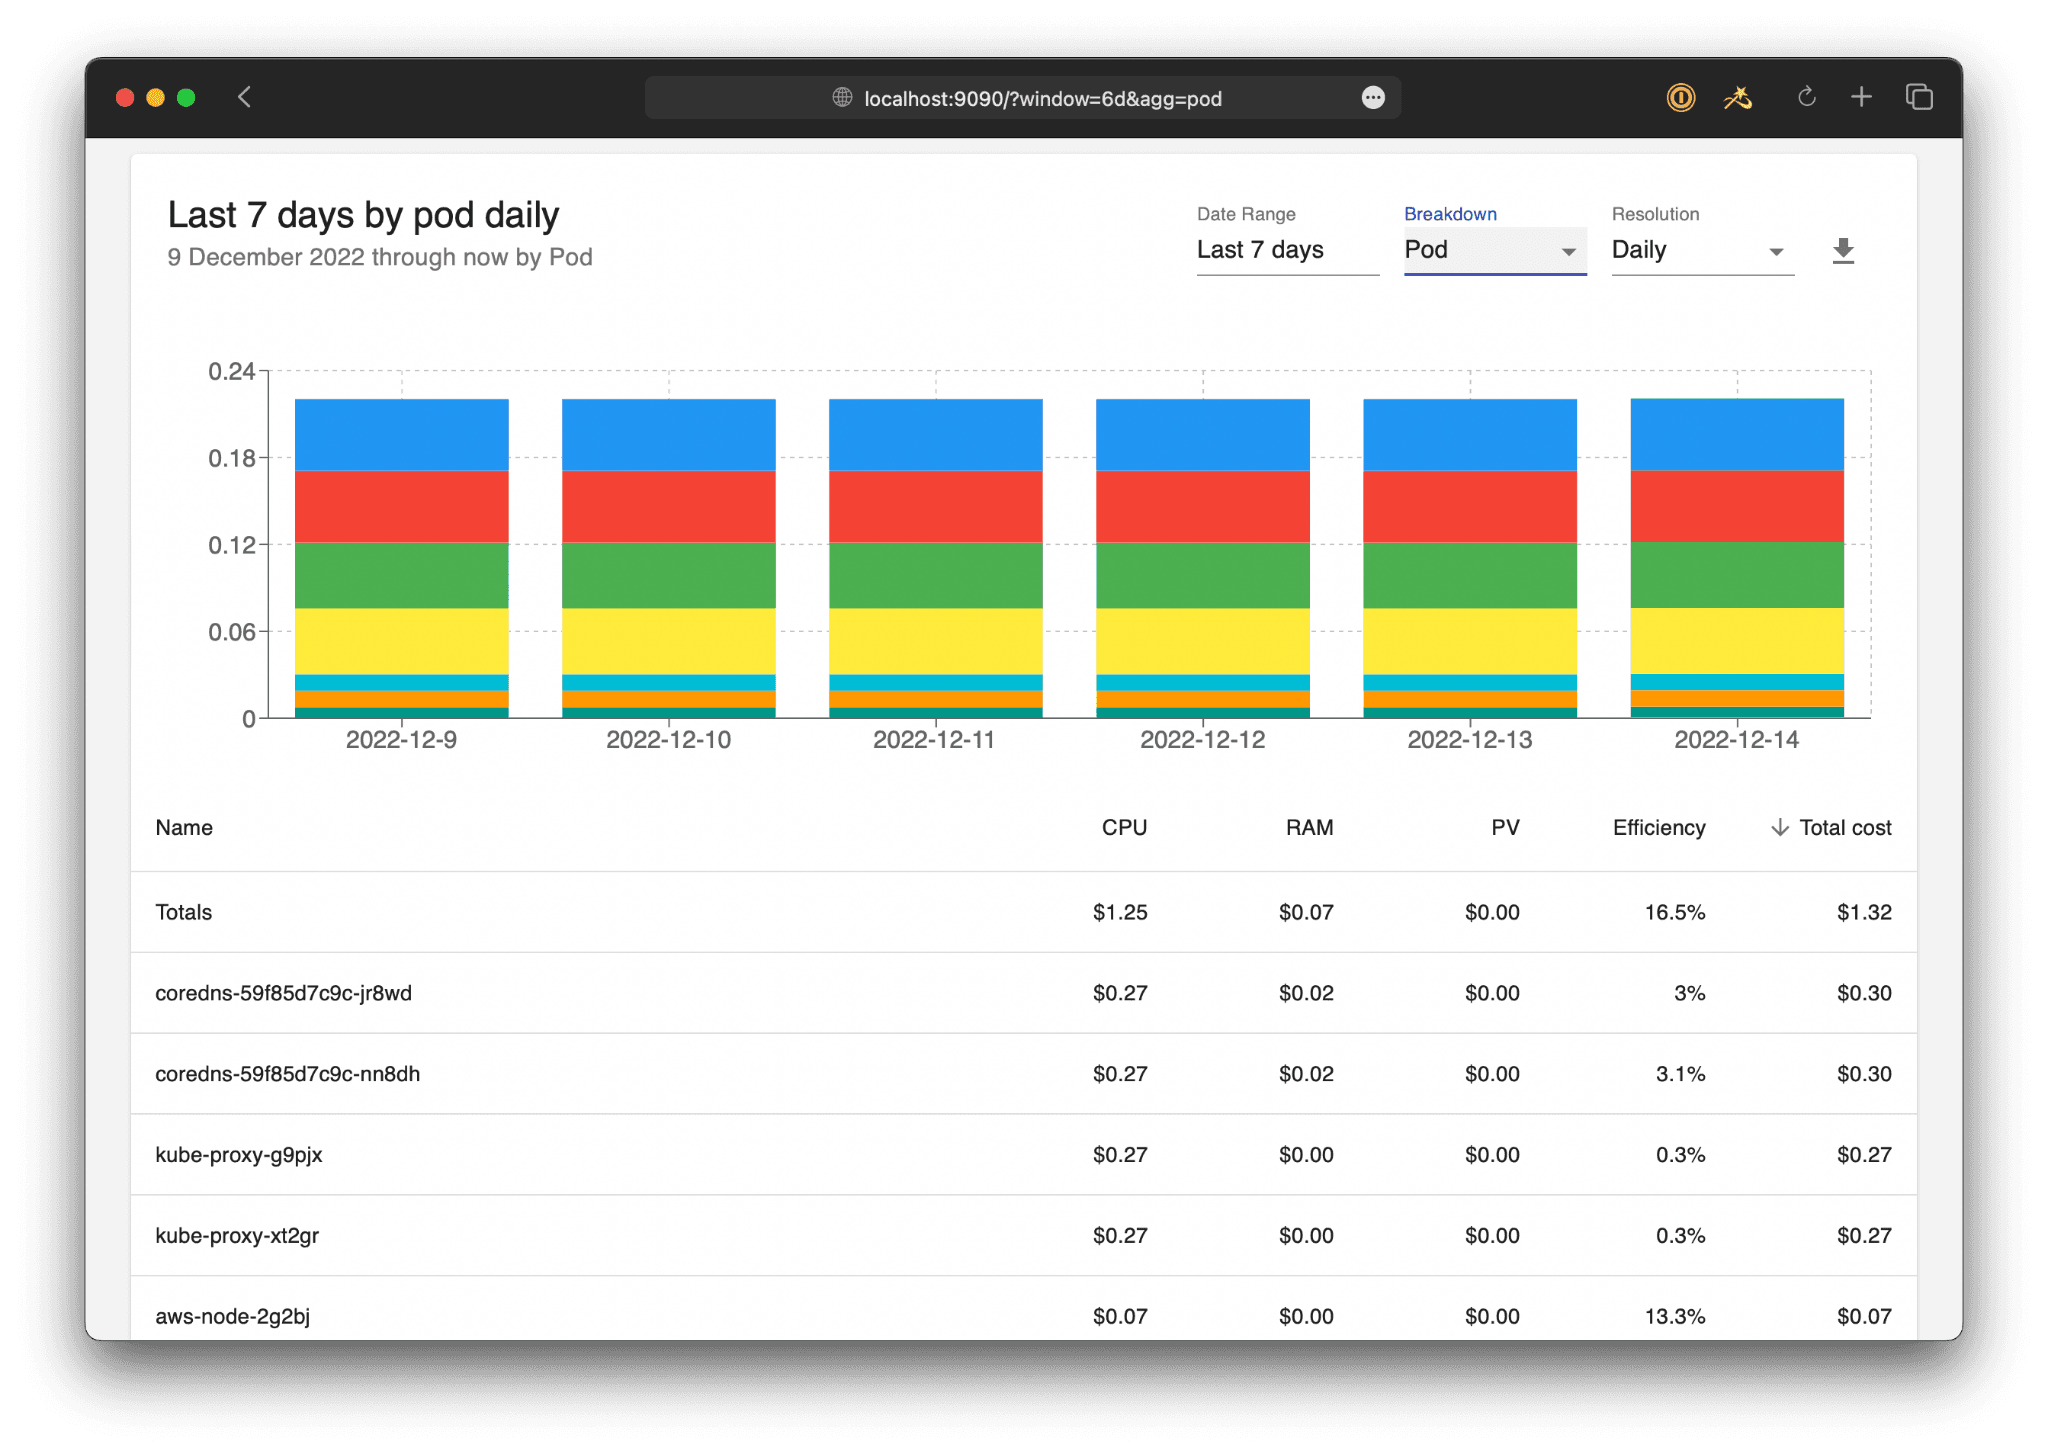
OpenCost is a free, open-source project maintained by the Cloud Native Computing Foundation.
The real business problem: You have a small cloud bill. You need basic visibility into where the money is going, but you cannot justify paying thousands of dollars for a commercial software tool.
The OpenCost benefit: You get standard, accurate cost monitoring without paying licensing fees.
Key capabilities:
- Zero cost to use.
- Vendor-neutral data model.
- Strong community support.
Limitations: OpenCost is strictly a data layer. It offers no automation, no built-in dashboards, and no out-of-the-box historical data retention. Your engineering team must build and maintain the reporting infrastructure itself.
Best for: Small startups spending less than $10,000 a month on cloud infrastructure that have the engineering time to build custom dashboards.
5. ScaleOps: Real-Time Autonomous Pod Rightsizing#
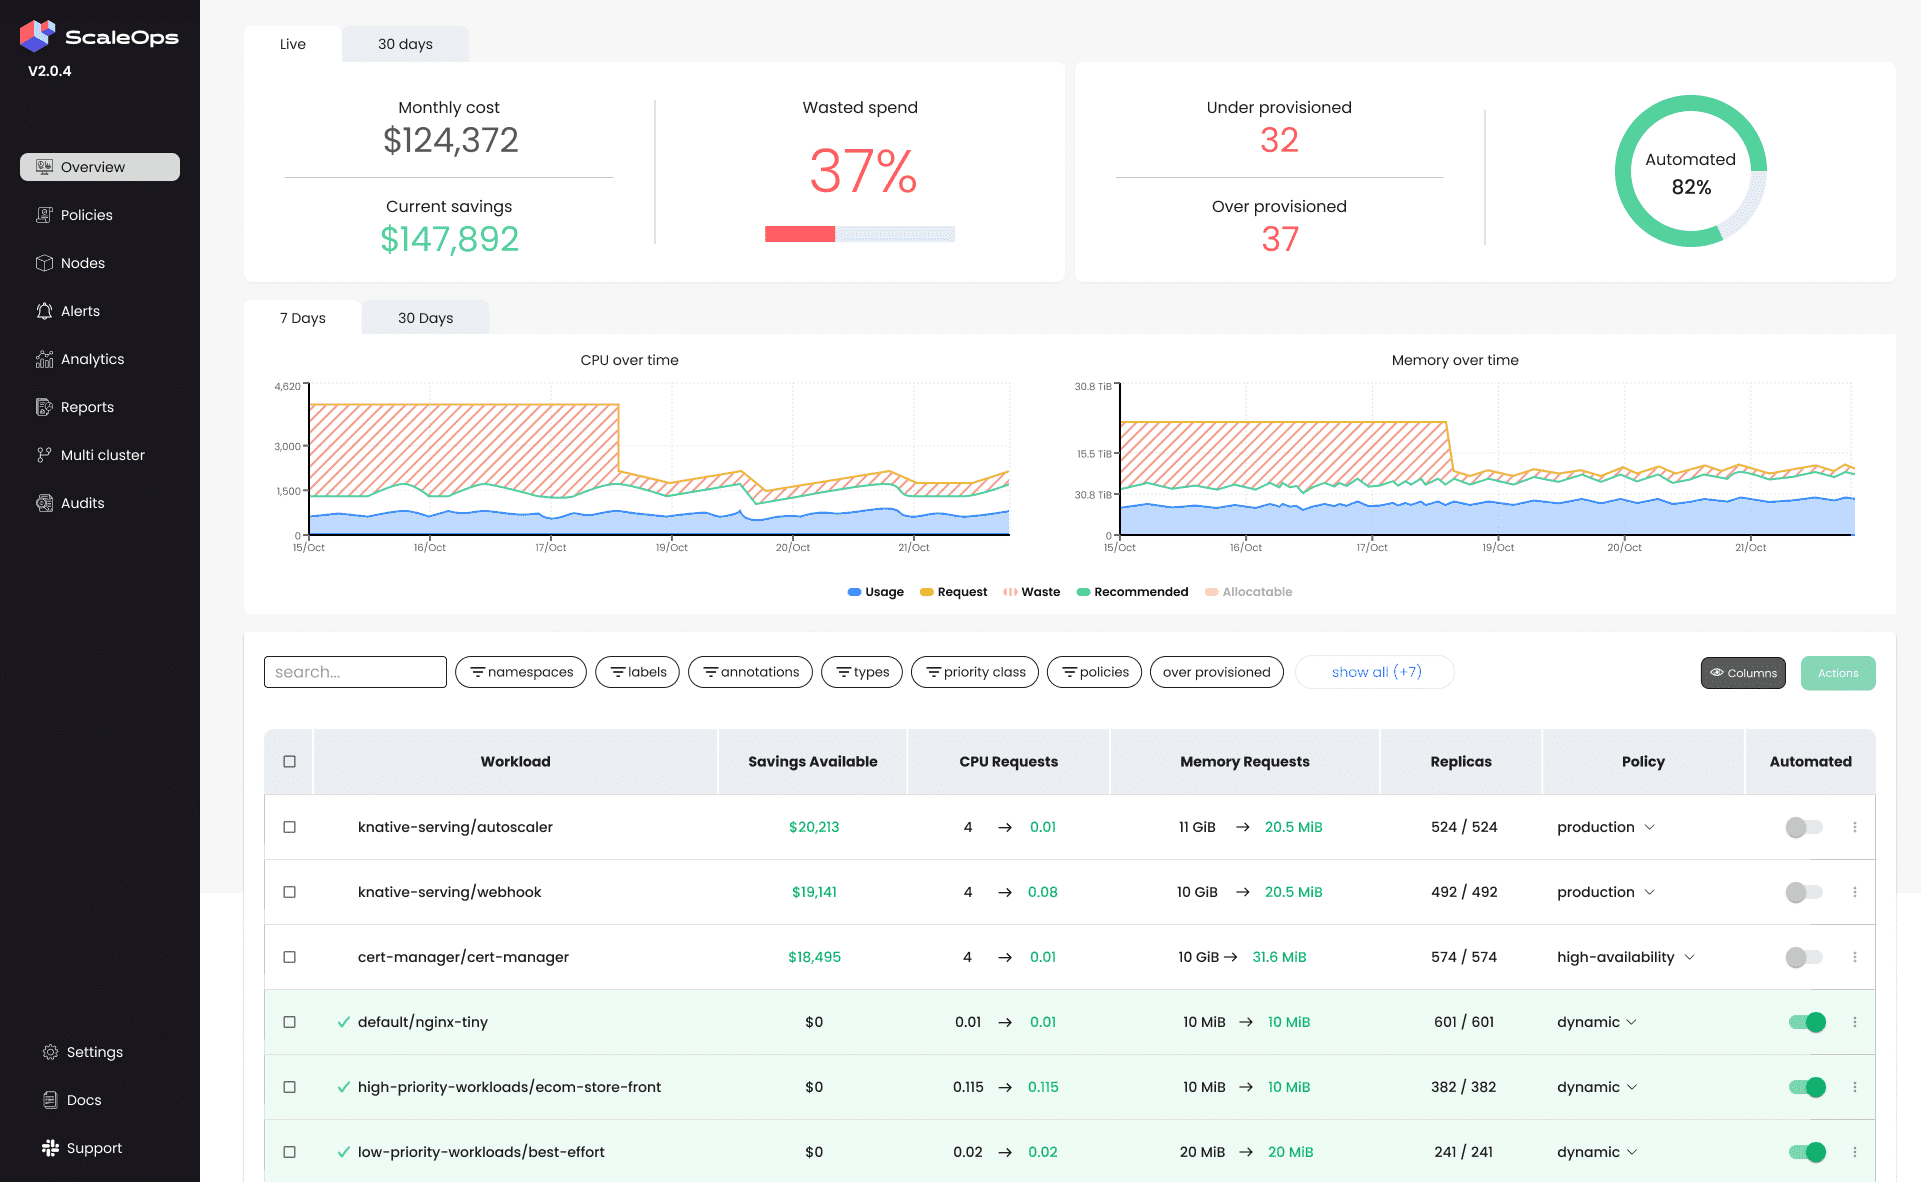
ScaleOps is a self-hosted platform that automatically adjusts application sizes.
The real business problem: Security regulations prevent you from allowing external software vendors to connect to your private cloud infrastructure.
The ScaleOps benefit: You can install the entire ScaleOps system directly inside your own private network. No data ever leaves your secure environment.
Key capabilities:
- Runs entirely inside your own cluster (air-gapped deployment available).
- Real-time adjustments to application sizing.
- Specialized optimization for Java-based applications.
Limitations: ScaleOps relies on standard Kubernetes resizing methods, which historically require pod restarts. They do not publish public pricing tiers; you must negotiate through a sales process.
Best for: Highly regulated industries (like defense or healthcare) that require strict air-gapped deployments.
6. CloudZero: Unit Economics for Engineering and Finance#
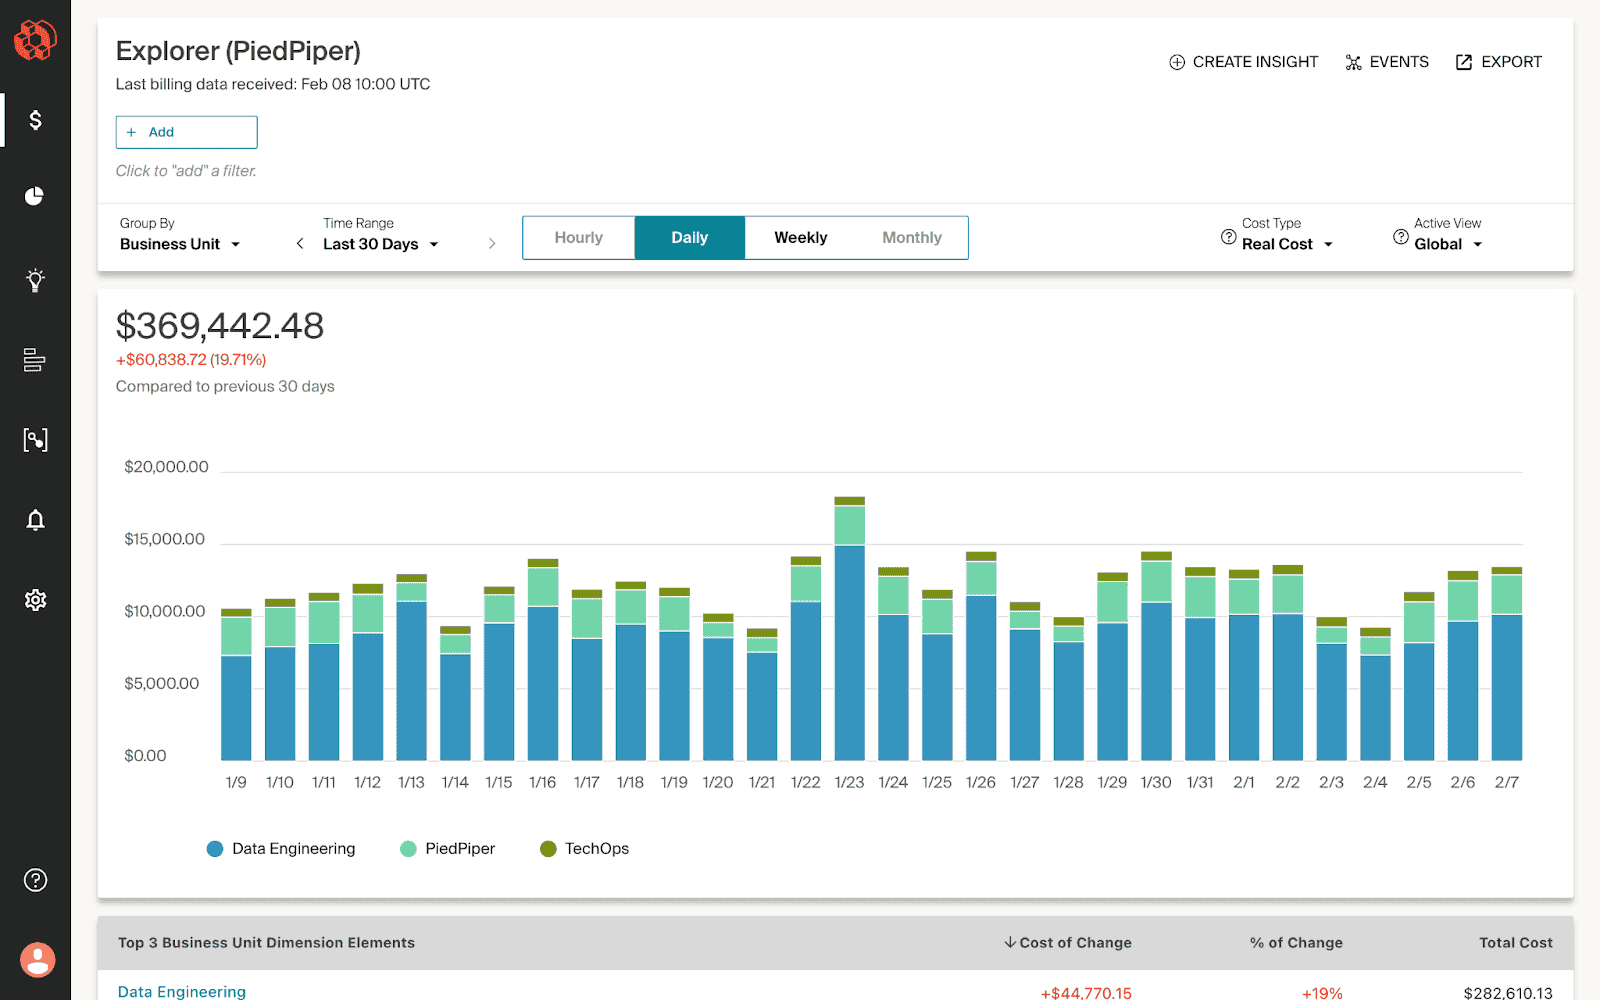
CloudZero combines your Kubernetes data with your overall cloud provider billing to create a unified financial view.
The real business problem: Engineering and finance speak different languages. Engineering talks about "CPU cores," while finance talks about "profit margins per customer."
The CloudZero benefit: CloudZero translates server metrics into business metrics. It tells you exactly how much it costs to support a specific customer or to process a specific transaction.
Key capabilities:
- Calculates unit economics (e.g., cost per customer).
- Aligns finance and engineering teams with shared reporting.
- Detects anomalies in spending patterns hourly.
Limitations: CloudZero is a financial intelligence tool. All optimization work must still happen manually in separate engineering systems.
Best for: Fast-growing software companies that need to calculate their exact per-user profit margin.
7. Karpenter: The Open-Source Node Provisioner#
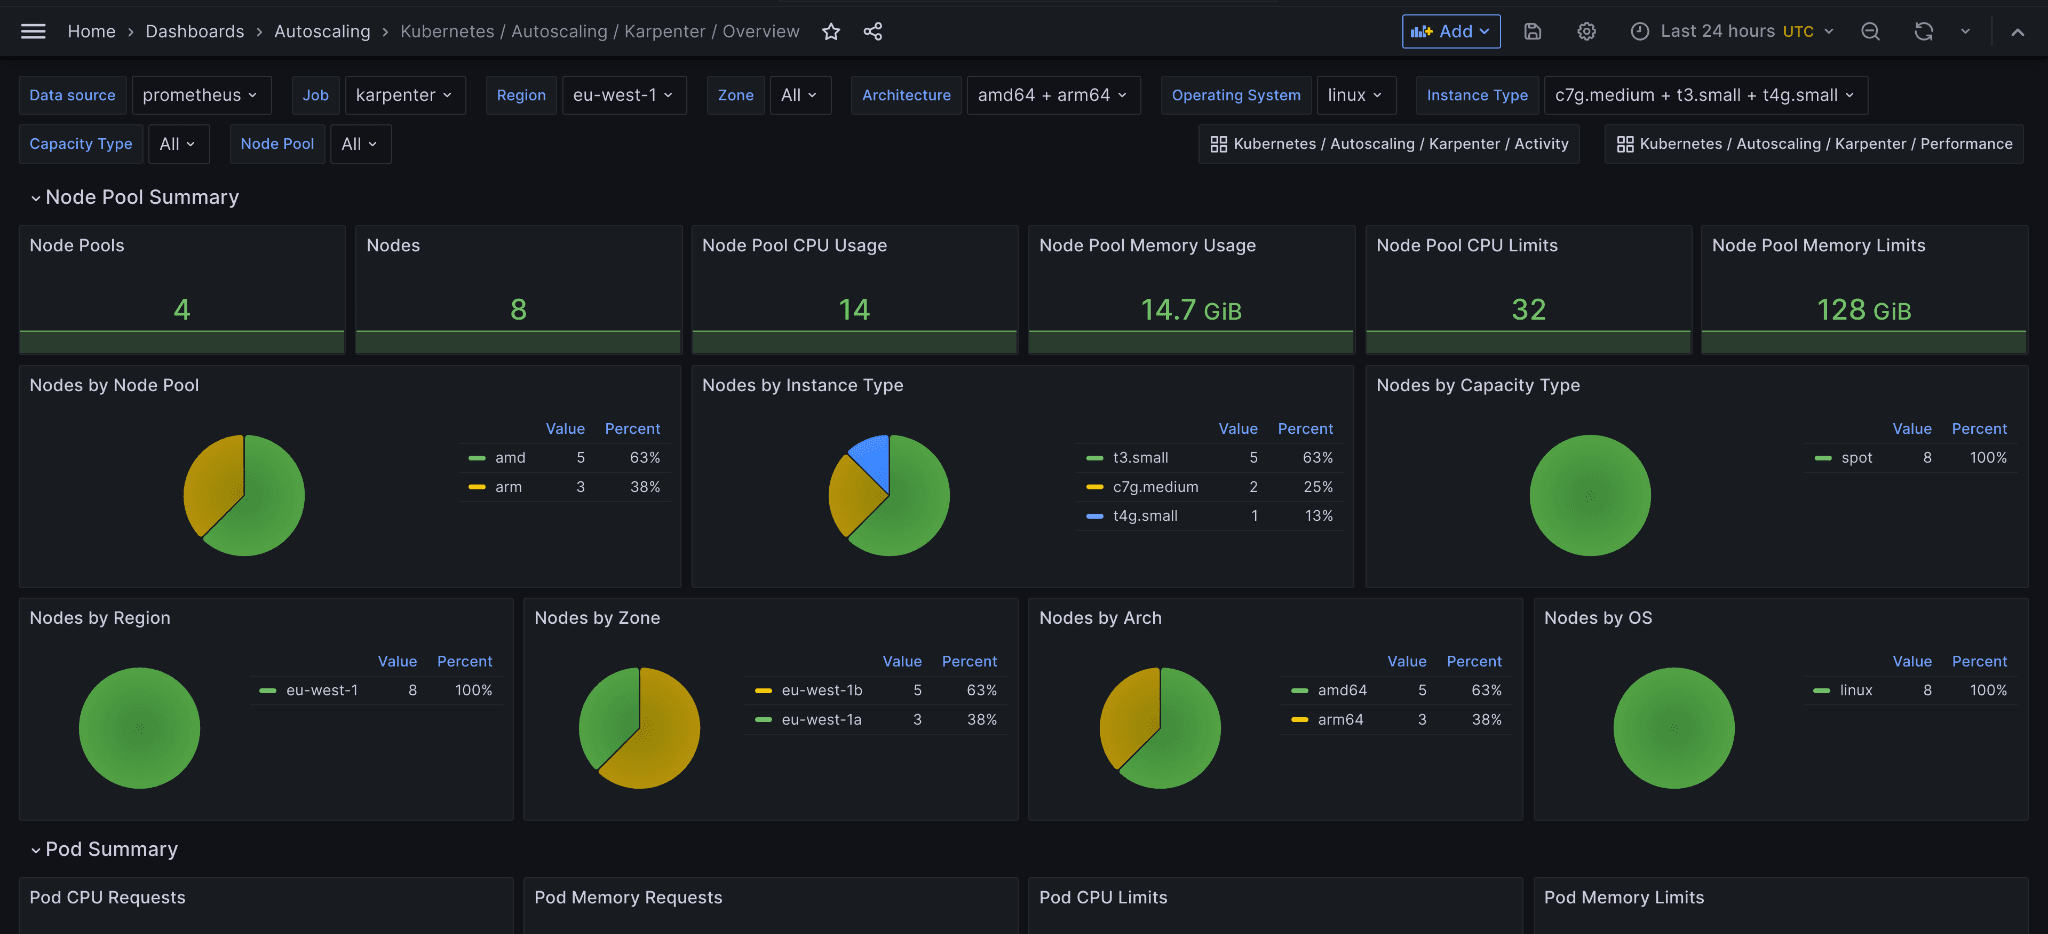
Karpenter is an open-source autoscaler created by AWS. It is not a standalone product you buy; it is a utility your engineers configure.
The real business problem: The default Kubernetes scaling tool is slow. When traffic spikes, users encounter errors while waiting for new servers to come online.
The Karpenter benefit: Karpenter provisions new servers in seconds rather than minutes. It bypasses older, slower grouping methods to instantly request the exact server size needed from AWS.
Key capabilities:
- Free and highly performant.
- Intelligent instance selection based on real-time AWS inventory.
- Seamlessly blends standard pricing with discounted "Spot" pricing.
Limitations: It works perfectly on AWS, but support for Google Cloud and Azure is experimental. It only manages the servers (nodes). It does not resize your actual applications. Karpenter must be paired with a workload optimization tool, such as DevZero, to achieve maximum savings.
Best for: Any company running Kubernetes on AWS in 2026. It is a mandatory foundation for cost control.
Read the Complete Guide to Karpenter
How to Choose the Right Tool for Your Situation#
Different business profiles require different solutions. Use this direct framework to make your decision.
| Your Situation | Recommended Approach |
|---|---|
| Cloud spend under $10,000/month | OpenCost (free) + manual engineering adjustments |
| Cloud spend $10,000 to $100,000/month | DevZero (free tier available) |
| Cloud spend over $100,000/month | DevZero for automation + Kubecost for corporate finance reporting |
| You run AI or GPU workloads | DevZero (the only platform with native GPU live migration) |
| Fintech or heavily regulated environment | DevZero (start with read-only) or ScaleOps (self-hosted) |
| You use AWS, Azure, and Google Cloud | DevZero (provides identical behavior across all clouds) |
| You need zero risk to production | DevZero (uses CRIU to prevent application restarts) |
For cloud-specific playbooks, see our guides to AKS cost optimization, EKS cost optimization, and GKE cost optimization.
What None of These Tools Will Tell You (But You Should Know)#
Software vendors prefer to talk about their dashboard features. Here are the hidden realities of cloud infrastructure in 2026.
1. GPU waste is concentrated, not widespread — and that makes it easy to misjudge: Across our whole fleet, GPU is only 3.3% of total cluster cost, because most teams do not run GPUs at all. But for the teams that do, it inverts: accelerators become the dominant line item, and they are the hardest resource to share because a workload holding a GPU holds all of it, used or not. The industry has spent a decade building CPU rightsizing tooling and almost none for accelerators. DevZero partitions GPUs and suspends idle GPU workloads specifically to close that gap.
Read Why Your GPU Cluster Is Idle
2. AI inference costs are exploding: As you add AI features to your software, you pay providers like OpenAI for every request. Routing a simple text-formatting task to a massive, expensive AI model is like using a sledgehammer to crack a nut. Cost optimization must now include AI request routing.
Explore the DevZero Inference Platform
3. Your testing environments are hemorrhaging money: Most teams focus their cost-cutting efforts on the live production environment. This is a mistake. Testing and staging environments are routinely overprovisioned and ignored. Fi Money cut 67% of their Kubernetes costs entirely from non-production environments before they ever touched a live server. Start your cost-cutting there. It carries zero risk and yields massive returns.
4. Visibility enables revenue decisions: Cost optimization is not just about saving money. It is about pricing your product correctly. DataBahn used DevZero's attribution tagging to figure out exactly how much infrastructure each of their clients consumed. They used this data to build profitable, customer-specific pricing tiers.
5. The visibility-action gap kills your ROI: The average engineering team installs a visibility tool in month one. They finally find time to implement the fixes in month three. By then, other engineers have deployed dozens of new, inefficient applications. The only way to win the cost battle is through continuous, autonomous optimization.
How to Run a Kubernetes Cost Assessment Today (No Commitment)#
You can see exactly how much money your cluster is wasting right now. You do not need to schedule a sales call or risk your infrastructure.
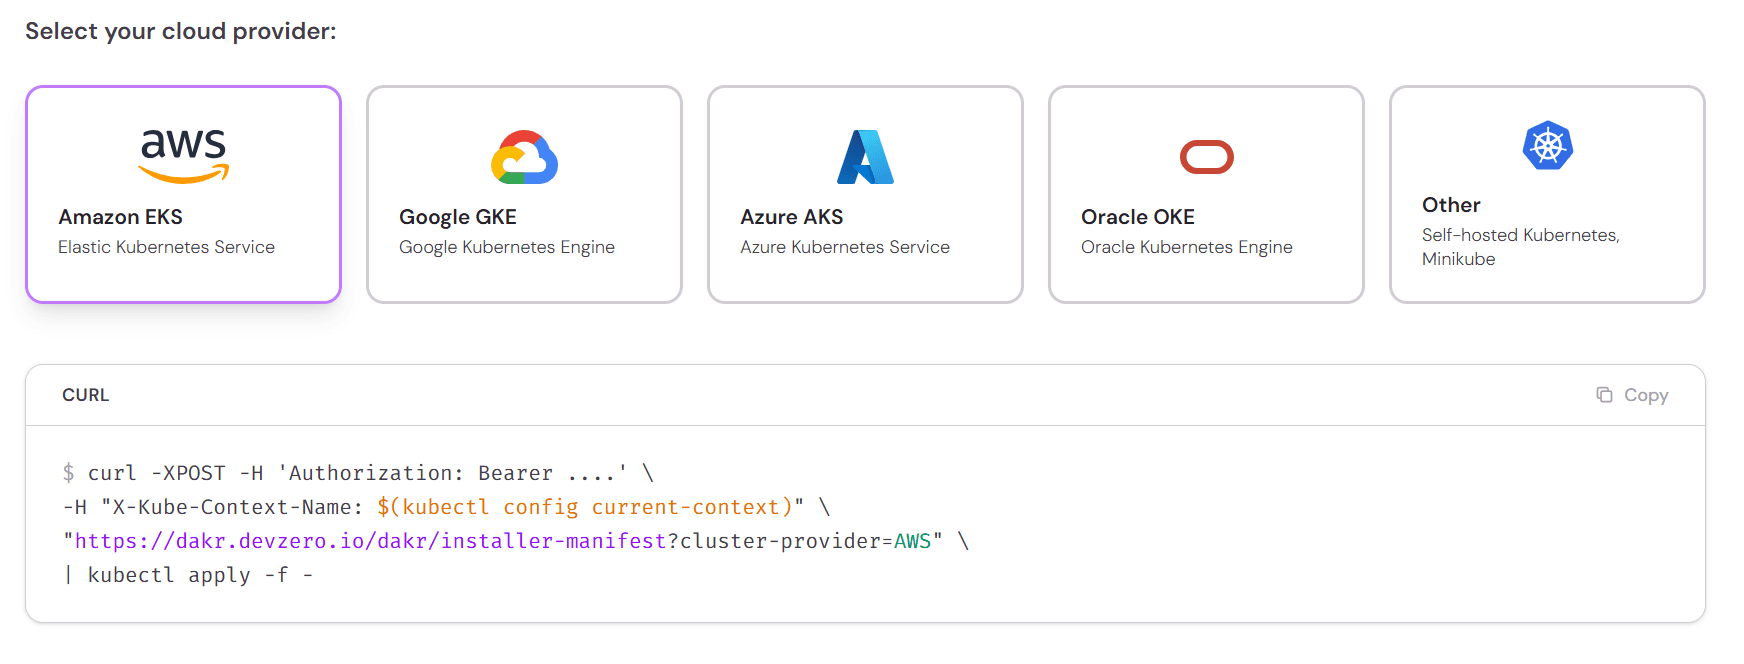
Step 1: Copy the DevZero read-only installation command from the product page.
Step 2: Paste it into your terminal. It takes less than 45 seconds to install. It requests zero write access. It cannot alter your systems.
Step 3: Wait 24 hours for the platform to analyze your traffic patterns.
Step 4: Open the dashboard and sort your applications by "absolute dollar waste." Do not look at percentages. Look for the specific applications wasting the most actual cash.
Step 5: Review the waste in your non-production clusters first. This provides the easiest business case for optimization.
How to Measure Savings So They Survive Scrutiny#
Most reported Kubernetes savings do not survive contact with a finance team, because "we reduced requests by 40%" is not a number that appears on any invoice. Real Kubernetes cost reduction has to be measurable in node-hours, not in dashboard percentages. Here is how to measure in a way that holds up.
Measure requested capacity, not just usage. Your cloud bill tracks the nodes you rent, and node count is driven by what your pods request, not what they consume. Dropping actual usage changes nothing on the invoice. Dropping requests lets the autoscaler remove nodes, and removing nodes is the thing that shows up in billing. The metric to watch is CPU-requested-as-a-share-of-capacity — the sample median above is 42.3%.
Baseline before you touch anything, over a full weekly cycle. Resources are typically sized for peak, which means a cluster measured only at peak looks far healthier than it is — the waste hides in nights and weekends. A baseline shorter than seven days will systematically flatter you. Every figure in this article uses a trailing 7-day window for exactly that reason.
Track these four, in this order:
- Node count and node-hours — the closest proxy to the invoice, and the number that actually falls.
- CPU requested vs. capacity — shows whether rightsizing is translating into removable nodes or just slack.
- CPU used vs. requested — the waste ratio itself. This is the number that should climb toward 1.
- Workload restarts and error rates — the guardrail. Savings bought with instability are a loan, not a win.
Attribute savings to a change, not to a month. Cloud bills move for reasons unrelated to you: traffic seasonality, a new service launching, a provider price change. Pin each optimization to a timestamp and compare the same workload against its own prior week, rather than comparing March to February and claiming the delta.
Watch for waste migrating rather than disappearing. Rightsizing pods without consolidating nodes often produces a cluster with the same node count and more headroom — real efficiency, zero savings. The check is simple: if requested capacity fell and node-hours did not, your scheduler is not reclaiming the space, and the money is still going out the door.
Time to Stop Paying for Idle Servers#
You face a clear choice. You can buy a visibility tool to watch your money burn in high definition, or you can deploy an optimization engine to extinguish the fire. The era of manually adjusting server sizes ended years ago.
For most growing companies, the path forward is straightforward. Start with a read-only monitor to prove the waste exists. Establish clear reporting for your finance team. Then, activate an autonomous engine that rightsizes your applications without restarting them.
By fixing the root mechanics of Kubernetes scaling, you reclaim your engineering time and your profit margins.
Frequently Asked Questions#
Does optimizing Kubernetes mean my applications will run slower?#
No. Proper optimization removes the idle, unused capacity that you pay for but never use. It does not restrict the resources your application actually needs to perform well.
Will installing DevZero violate our security or compliance rules?#
No. DevZero starts with a read-only agent that takes less than 45 seconds to install. It cannot alter your systems or access your private customer data, making it completely safe.
How do I get my engineering team on board with cost-cutting?#
Frame it around saving their time. Automated tools eliminate the tedious, manual work of adjusting server sizes, allowing engineers to focus on building your actual product.
Can I just negotiate better pricing with AWS or Google instead?#
You can secure long-term discounts, but a negotiated discount applies to capacity you should not be renting in the first place. When the median cluster uses under a fifth of the CPU it reserves, a provider discount trims the price of the waste instead of removing it.
How does DevZero resize applications without causing downtime?#
We use specialized live-migration technology (CRIU) that pauses your application, resizes it, and resumes it in milliseconds. It avoids the traditional restart process entirely.
We only run a few small applications; do we still need optimization software?#
Likely not. If your monthly cloud bill is under $10,000, start with a free visibility tool like OpenCost and have your engineers make manual adjustments to save money.
My team uses a mix of AWS and Google Cloud. Can DevZero handle both?#
Yes. DevZero is entirely cloud-agnostic, meaning it provides the exact same automated optimization and visibility across AWS, Google Cloud, Azure, and private servers.
What happens if my website traffic suddenly spikes while using DevZero?#
DevZero uses predictive machine learning to forecast traffic trends based on history. It adds necessary server capacity before the spike hits, ensuring your customers never experience slowdowns.
What are the best Kubernetes cost optimization tools in 2026?#
The leading options in 2026 are DevZero, Kubecost, Cast AI, OpenCost, ScaleOps, CloudZero, and Karpenter — each suited to different needs, from pure cost visibility (Kubecost, OpenCost) to automated optimization (DevZero, Cast AI, ScaleOps) to node-level bin-packing (Karpenter).
What's the difference between a cost visibility tool and a cost optimization tool?#
Visibility tools like Kubecost and OpenCost show you where your Kubernetes spend is going but don't change anything automatically. Optimization tools go further and actively resize, reschedule, or rightsize workloads to reduce that spend — the distinction matters because visibility alone doesn't lower your bill.
What tools identify Kubernetes overprovisioning best?#
Tools that measure actual CPU and memory usage against requested resources across your whole fleet, rather than sampling a few namespaces, surface overprovisioning most reliably. Across real production clusters, median CPU utilization against reserved capacity is often well under 20%, so overprovisioning is usually the norm rather than the exception.
How can I reduce Kubernetes costs without rearchitecting my infrastructure?#
Rightsizing existing workloads to match actual usage, consolidating underutilized nodes, and adopting spot or reserved capacity where appropriate can meaningfully cut spend without any changes to how your applications are built or deployed.
Does Kubernetes cost optimization software cause downtime?#
It depends on the tool's update mechanism. Tools that apply changes through pod eviction and recreation carry some restart risk; tools built around live, in-place resource updates are designed specifically to avoid disruption during optimization.

Debo Ray
Co-Founder, CEO


